The wave count appears pretty clear as (iii) or c complete from the 1250 low on the 16th. Monday should see an extension of the post-report letdown to below 1320. EWI assumes that we are in a 5th up to a new high (since Wednesday's update). A wave (iv) bottom Tuesday would sync up with an I1 low.
The ability of the DJI to retrace all the way to a nominal new high indicates that we are indeed in a 5th up to the mid-April I1 high.
QE2 stated the intent to purchase $600Billion of treasury securities. There was no warranty, written or implied, that there would be a similar increase in the Fed balance sheet. Since 8/11/2008 the balance sheet has increased $300Billion.
The composition of the balance sheet has shifted from the asset types acquired in QE1 to Treasuries.
QE2 has increased Treasuries from 777Billion to 1,323Billion, or about 550Billion since 8/11/2010. It has decreased MBS and Agency securities at the same time, reducing the risk profile while leveraging up. What a wonderful playground!
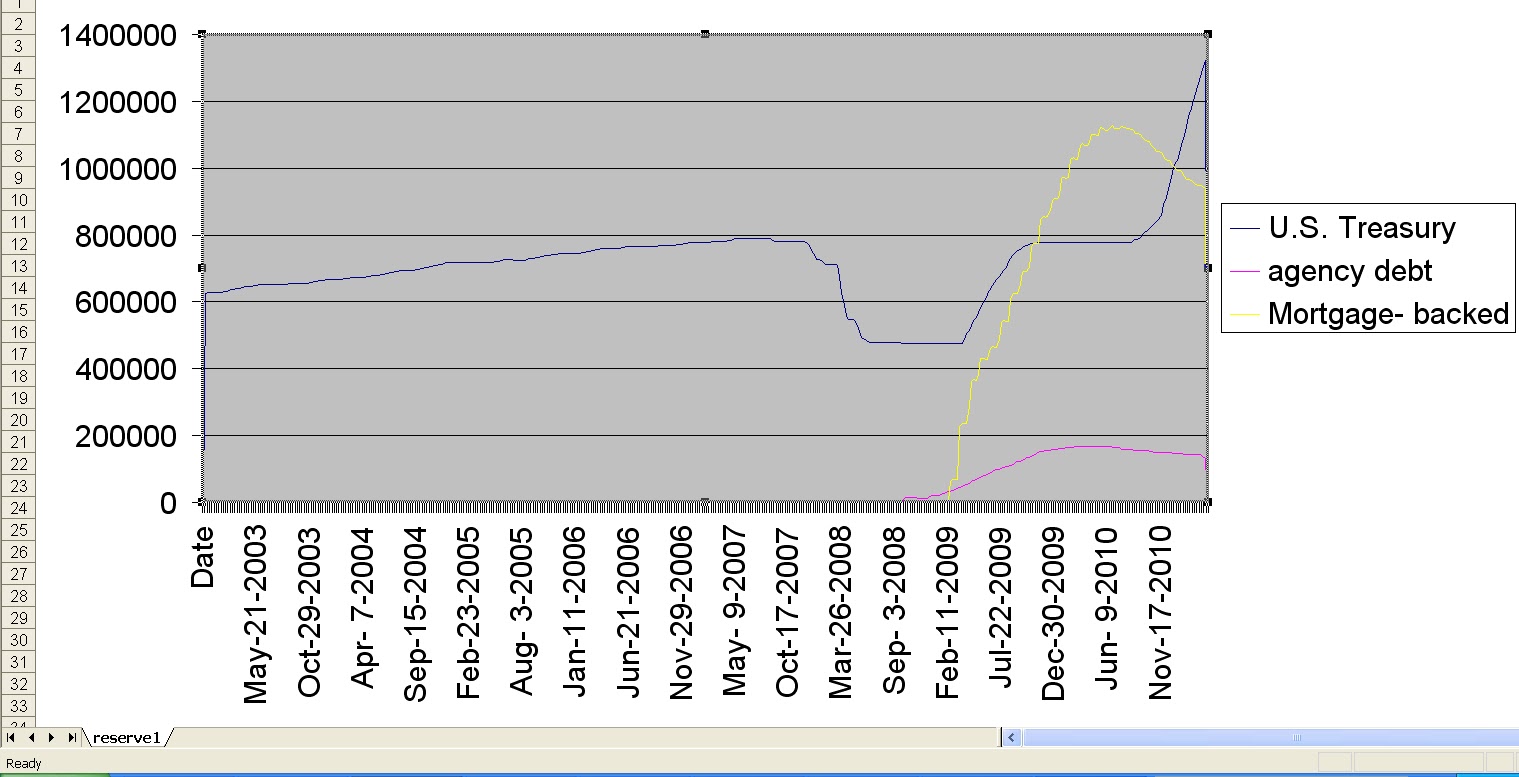
The tripling of the Fed balance sheet since 9/2008 has caused an explosion in worldwide commodity prices by providing cheap and easy money to hedge funds to guide prices ever upward. Ben quotes U.S. stated inflation as tame, by quoting CPI ex-food and energy. The cycle goes thus, first the reserve currency expands it's base and, since foreign contracts are on the whole denominated in dollars, there arises foreign commodity inflation in local currencies along with their stock markets, then foreign CPI which is much more commodity-sensitive than the U.S., and the circle arrives back in the U.S. with pre-cursors to domestic inflation in industrial commodities. Only after this has gone full circle will inflation register in PPI followed by CPI because companies producing physical products in the U.S. will be forced to raise prices, first wholesale, then retail.
The UN food index has been steadily hitting new record highs, as evidenced by the riots throughout the mideast and will bleed into the Phillipines and other third-world Asian countries with high unemployment and a youthful demographic.
We have already experienced a burst of industrial commodity prices as well as grains and meats priced in dollars. The following is 24-month change in CRB industrial commodity index which does not include any foods:
Profit margins are going to be squeezed, then finally wholesale and retail prices will go up. The stock market cares deeply about margins. The last spike of this magnitude was 1973-74, the worst inflation-adjusted stock market since 1930-32. This places the Fed in a box because if they wait too long and continue to key policy on the stock market they will commit the same mistakes as the Burns and Miller Fed chairmanships, leading to hyper-inflation fears and a decimated bond market.
The next stage in the inflation pipeline, after the Fed exports inflation around the world and it arrives back in industrial commodities, is the PPI.
Once the March data point comes out the evidence of inflationary pressures will be alarming.
Here is the 24-week rate-of-change of the monetary base:
On a brighter note the weekly technical composite ticked down another notch, to -14, already on a normal sell signal. -16 I close my eyes and sell, sell, sell.
Saturday, April 2, 2011
Friday, April 1, 2011
4/1 Daily Commentary
The stock index ETFs closed the day lower than their open with Nasdaq relatively weak.
We are in a period of high I1 values. According to the rule set as originally established it is OK to sell I1 values less than 8, which would have allowed stepped-up shorts Tuesday of this week.
Looking at +7 peaks in I1 history shows there is little fear of missing a top by waiting until the I1 peak prior to a sustained move below +7 and the date that I1 declines below +7. Intro and Concepts contains the I1 charts to verify this trading rule. The next I1 peak that precedes a sustained move below +7 is 4/18-4/19 and the date I1 declines back below 7 is 4/26. I think that waiting for the mid-May I1 peak would be past the stock market high. Trading rules have been modified for the above.
The wave count appears pretty clear as (iii) or c complete from the 1250 low on the 16th. Monday should see an extension of the post-report letdown to below 1320. EWI assumes that we are in a 5th up to a new high (since Wednesday's update). A wave (iv) bottom Monday or Tuesday would sync up with an I1 low. Holding 4% SDS during the jobs report discounting rally was tough but should allow me to exit gracefully.
The ability of the DJI to retrace all the way to a nominal new high indicates that we are indeed in a 5th up to the mid-April I1 high.
The Euro ran up to it's old highs where I bought the short ETF, EUO.
The technical position of the stock market is getting to an extreme juncture. I'll be posting a Weekly tomorrow with the monetary and technical backdrop.
4/1 1:30
The technical position of the U.S. stock market is reaching extreme overbought. The next 2 weeks' data should be enough to throw the weekly composite to -16, the close-your-eyes-and-sell level. Right now it is -13.5.
The monetary base, the "controllable" aggregate is accelerating to an upper bound that will demand restraint within the Fed. The monetary base is composed of primarily reserves which are subject to the money multiplier, thus an acceleration of the base can lead to an explosion of the monetary aggregates.
Central bankers cannot afford to allow this potential M1/M2 explosion to occur. The record prior to Ben was a 12% expansion that marked the 2000 market top. Currently we are at 21% with another expansion to be added to the data this weekend. QE2 directly adds to the monetary base by expanding the Fed's balance sheet. Looking at the chart above one can see when and why Ben started QE2, because the base was naturally contracting due to lack of lending, reaching it's rate-of-change nadir mid-year 2010. The entire world is freaking out with this program.
M1 has already peaked on a 1-year rate of change. However, the Fed cannot assume that bankers will not start lending and increase the M1 multiplier. Thus, the uncertainty principle should cause an early end to QE2.
Here is a 4-week average of a 24-week rate-of-change in M1. My analysis going back to 1965 indicates that a rate in excess of .05 is excessive and a return back below .035 brings trouble to the stock market. It should be apparent how responsive M1 is to the monetary base and thus to FOMC operations.
The monetary base, the "controllable" aggregate is accelerating to an upper bound that will demand restraint within the Fed. The monetary base is composed of primarily reserves which are subject to the money multiplier, thus an acceleration of the base can lead to an explosion of the monetary aggregates.
M1 has already peaked on a 1-year rate of change. However, the Fed cannot assume that bankers will not start lending and increase the M1 multiplier. Thus, the uncertainty principle should cause an early end to QE2.
Here is a 4-week average of a 24-week rate-of-change in M1. My analysis going back to 1965 indicates that a rate in excess of .05 is excessive and a return back below .035 brings trouble to the stock market. It should be apparent how responsive M1 is to the monetary base and thus to FOMC operations.
4/1 noon
I expect 1 more high to complete a 5-wave from yesterday. There is normally a jobs report letdown in the afternoon after a report rally.
Dollar rally did not exceed it's 90-minute M/A threshold, but the decline off it's high was steep and a completed 3 back to hourly support. I bought 2% EUO at 17.75.
4/1 10:15
I'm still holding 4% SDS and 1% ZSL.
We are in a period of high I1 values. Looking at +7 peaks in I1 history shows there is little fear of missing a top by waiting until the I1 peak prior to a sustained move below +7 and the date that I1 declines below +7. Intro and Concepts contains the I1 charts to verify this trading rule. The next I1 peak that precedes a sustained move below +7 is 4/18-4/19 and the date I1 declines back below 7 is 4/26. I think that waiting for the mid-May I1 peak would be past the stock market high.
Subscribe to:
Posts (Atom)


