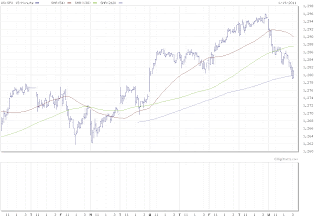
Came in today with 4% SSO, having sold 2% yesterday near the close. The stock market marched downward all day. The following chart shows my 2 entry points today, the first (green line) was sold out for no loss when a 5 down developed. The second (blue line) stuck and I bought 4% in the final hour at 79.66. So I'm 8% SSO.
This should be the bottom of the wave 4 I've been expecting.
Those of you reading this blog know I've been keeping in and out of long dollar or short Euro. Today this trade stuck and I made money shorting Euro using a 1-minute, 67-unit M/A and 157-unit M/A. I'm currently out waiting on a 20-cent break of the 15-minute, 90-unit M/A (green line) currently at 134.55, giving a trigger at 134.35. I have a positive sentiment gauge for the dollar so I'm using the currency/stock market correlation to play opposite ends of the risk spectrum.
I'm short gold from 1372.40, which I believe is on the cusp of a larger decline. Breaking 1366.40 basis Feb futures should kick the legs out from under it.
Caveat: I1 is up which is bullish for all risk assets, Euro included. I'm offsetting long stocks with these other markets.
Here is the I1 for the next 3 months:
20110119 11.4923
20110120 13.90587
20110121 16.33031
20110124 18.86588
20110125 21.5293
20110126 23.26398
20110127 24.94553
20110128 26.78996
20110131 27.08342
20110201 28.07677
20110202 28.24126
20110203 28.64861
20110204 29.44478
20110207 30.08323
20110208 30.98431
20110209 31.61372
20110210 32.7958
20110211 34.23365
20110214 37.53806
20110215 40.75786
20110216 43.77328
20110217 47.36712
20110218 50.57693
20110221 52.17321
20110222 52.59504
20110223 52.23759
20110224 52.12646
20110225 52.30561
20110228 50.78321
20110301 49.95083
20110302 48.75886
20110303 48.7545
20110304 48.60954
20110307 48.91933
20110308 50.65648
20110309 53.18327
20110310 55.83762
20110311 58.13648
20110314 61.86496
20110315 65.04965
20110316 68.23689
20110317 71.06565
20110318 74.00252
20110321 78.1513
20110322 81.3552
20110323 84.10808
20110324 85.52601
20110325 86.05031
20110328 84.2088
20110329 80.85115
20110330 77.50088
20110331 74.00951
20110401 71.06763
20110404 69.29059
20110405 68.73553
20110406 68.67549
20110407 69.01423
20110408 69.86341
20110411 71.74323
20110412 72.75928
Subscribe to:
Post Comments (Atom)


According to your I1, It looks like the S&P is headed to a top of 1350 or so in the Middle of March. Do you see a let up in the stock market between now and then?
ReplyDeleteThank you,
Mark S