Tuesday, May 31, 2011

5/31 Daily Commentary

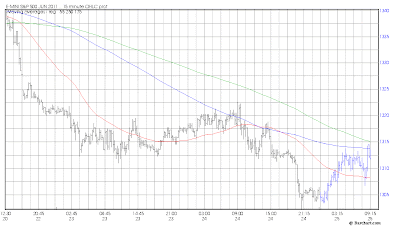
I came into today with no short ETFs but started stepping into a position with 3% SDS and 2% DXD.  The short-term timing component of I1 registers a potential high tomorrow.
The 30-day I1 declined below +6.5 today, which is why I chose to enter the ETF shorts.  I will increase short ETFs until they are at least 10% capital.

I don't see the dollar launching a solid bull phase until QE2 runs out.

There is a Wikipedia table listing history's greatest earthquakes going back to 869AD in Japan when records were kept.  Since 2004 there have been 5 that have made the list, all >= 8.5 Richter.  I realize that recordkeeping was sporadic and intensity only estimated in the pre-1900 quakes.  However, this is an unmistakeable trend.

5/31 3:40

I was out working on the water tank and getting parts in Magdalena. 
SP futures came down to 30-minute M/A and found support.  Had I been around I would have sold have of the shorts there. 


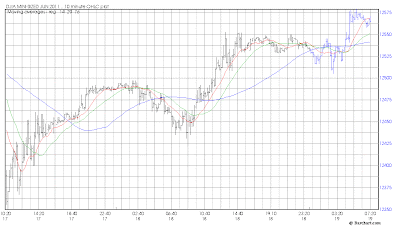
The market still has to get through tomorrow before forces gang up to push it down.  DJI 12,585 is still my drop dead point.
Oil is responding to middle east politics and less to leveraged dollar trade.
I see oil rising into beginning of September.

5/31 10:50

I was able to enter stock short ETFs this morning.  These should be good until July.
The longer trade view is embodied not only in the longer-trade ruleset of I1, which states:
Rule# 4) For longer-term traders:

a) stay long until final peak or until it falls below 9.0, whichever is lower.
b) stay short as long as next peak <3.0.
c) ignore I1 moves lasting less than 1 week or with a swing < .5.
This is in the Intro and Concepts section.  According to this ruleset a longer trade will be short until mid-August.

The longer trade is also in the 30-day M/A of I1 which has a rule requiring shorts to wait if the 30-day I1 is above 6.5 until it returns back to (under) 6.5.  This occurs today.

So, I got a nice position entry ahead of what should be a big move into August.  The entry level was close to the upper envelope of the critical M/A, so I have a short stop-loss.  Life is perfect.

5/31 9:40

The DJI critical resistance M/A envelope is at 12,580.  (12,411 x 1.35%).

5/31 9:35

I just bought 2% DXD at 16.88 with a stop of DJI 12,585.
I began stepping into short stock ETFs with 3% SDS.  I still own the 1% SOPIX and 1% UCPIX short funds that I've held for several weeks.
The NASA and JPL quotes that I pulled concerning the Japan quake point out the sensitive nature of our magnetic field.  Normally the principal factors affecting the magnetic field are the position of the moon, the level of solar activity, and the seasonal shifts in stratospheric and atmospheric currents.  The Japan quake disrupted this relationship not only because it was stronger than Chile (9.0 vs 8.8) but because of the intense and numerous pre- and after-shocks.  I certainly hope this is not a precursor of things to come.  It's affect on the financial markets was magnified because of the level of integration of Japanese society into the fabric of the international financial system.

QE2 ends this month and I am confident the markets will discount this ahead of time.  The rate of change of liquidity will diminish (measured in the monetary base).  This will cause leveraged commodities buying to scale back significantly or cease altogether.  The dollar trade will still exist but it will not be flowing into commodities.  I expect commodities to recover into mid-June regardless of what the stock market does.  Thus the stock market and the dollar will be early in reflecting the reduced scale of liquidity.

5/31 8:15

Bought 3% SDS at 20.17.  This is possibly early, given the projection of a top tomorrow, but it is near chart resistance.

Monday, May 30, 2011

5/31 pre-open

Stock futures continued the rally as predicted last week.  I'm waiting on a short entry point.
It's time to reiterate the strategic view.  In Mid-May I1 issued a formal sell signal which will last until mid-August.  This signals occurs when I1 peaks below +7 and begins a decline that takes it below 3.25.
Usually I1 is accurate for the short-term (less than 2 week) for the stock market as well, but the Japan quake temporarily induced an 8-day lead into the series.  I believe that the distortion is now leaving human behavior.

USGS, Japanese earthquake specialists, and NASA have formed some conclusions about the Japan quake.
The Richter 9 quake probably shifted the position of Earth's axis about 6.5 inches, said Richard Gross, a geophysicist at the Jet Propulsion Laboratory in La Canada Flintridge, in an e-mail.

The temblor also should have caused Earth to rotate somewhat faster, shortening the length of the day by about 1.8 microseconds, he said.
Data-crunchers had determined that the temblor's force moved parts of eastern Japan as much as 12 feet closer to North America, scientists said, and that Japan has shifted downward about two feet.
USGS had determined that the entire earthquake sequence -- including associated foreshocks and aftershocks -- had included 200 temblors of magnitude 5 or larger, 20 of which occurred before the big quake hit.
Earth's rotation changes all the time as a result of not only earthquakes, but also the much larger effects of changes in atmospheric winds and oceanic currents," he said. "Over the course of a year, the length of the day increases and decreases by about a millisecond, or about 550 times larger than the change caused by the Japanese earthquake. The position of Earth's figure axis also changes all the time, by about 1 meter (3.3 feet) over the course of a year, or about six times more than the change that should have been caused by the Japan quake."

Gross said that while we can measure the effects of the atmosphere and ocean on Earth's rotation, the effects of earthquakes, at least up until now, have been too small to measure. The computed change in the length of day caused by earthquakes is much smaller than the accuracy with which scientists can currently measure changes in the length of the day. However, since the position of the figure axis can be measured to an accuracy of about 5 centimeters (2 inches), the estimated 17-centimeter shift in the figure axis from the Japan quake may actually be large enough to observe if scientists can adequately remove the larger effects of the atmosphere and ocean from the Earth rotation measurements.

Since some of I1 inputs include atmospheric and oceanographic currents projected into the futures it would make sense that such a large quake and the pre- and after-shocks would alter these natural phenomenon.  The earth's magnetic field is a sensitive tuning fork which will return to the pitch predicted.  The belief that I1 is now returning to synchronization in it's predictive ability is indicated by the first complete cycle since the quake in it's sensitive short-term timing component, which reflects the effects of solar and lunar position on the earth's magnetic field.  This is now indicating that Wednesday is the first potential top date in it's current up-cycle.


The I1 prediction of a decline into mid-August is confirmed by cycle data which I have been laboring to bring up to date.  The cycles detected in DJI indicate a bottom in September.
The cycles detected in S&P500 also reflect this same time horizon for a decline.
With cycle data the normal caveats apply, that this is looking backward at fixed cycles over the past 50 years.  Said cycles swing into precision and out again and this data source is not as reliable as I1.

5/30 Monday Evening

I exited my short ETFs on the bottom day and am waiting for a last-gasp 3-wave rally to short the stock market again.
Thursday, Friday, and this evening completed the a and b waves of a abc up in the stock market.  SP futures up 6, Nasdaq up 12.
Things are working out according to script.  Wednesday mid-day is my ideal short day.  Nasdaq 2366 is a  good target, but much depends on the wave count at the time.  2366 will be a daily M/A on Wednesday.
In accord with the hourly stock market trend, silver looks destined to complete it's retracement rally at 39.30.  This is previous wave (iv) high and M/A.


Wednesday, May 25, 2011

5/25 Daily Commentary

I'll be on the road Thursday through Monday, so I'll just be monitoring after the close tomorrow and Friday.
Today the stock market advanced in a 5 wave, indicating more upside to come.  DJI critical M/A is currently 12,430 and will be broken on rally to 12,597.

Reasonable targets are SPX 1335 and DJI 12,560.

Timing involves the components of I1.  First the Time Elevations series, which tracks I1 components at high and low values.  It generates a signal the day after Memorial Day:

The second is the solar-lunar component of I1, which indicates the day after Memorial Day as a potential top day.  This series indicates that prices will hold up through June 9, but I don't believe the peak will wait that long.  I want to get short May 31.

I apologize for getting the envelope for DJ futures wrong.  Reviewing my notes the correct envelope is 1.1%.   DJ futures ticked slightly below but DJ cash stayed comfortably within the envelope.
Happy Memorial Day, everyone!

5/25 3:30

This 30-minute close broke the SP futures 30-minute M/A.  By chance this occurs right on the DJI critical M/A.  The rally has formed a 5 up so a correction then another 5 up is in store.

5/25 12:30

SP futures 30-minute M/A will be broken on a 30-minute close above 1320.50.

5/25 10:30

CJ posted a link to the fallout from a Greek de-facto default.  Revenge of the Greeks
While Greece will not seek explicit revenge there is a fair amount of animosity toward their northern neighbors.  The Greek people will not go quietly into the night.  When the default comes it will hit all in the pocketbook and their history with the red party will assure plenty of street action.  This will fan the distress in Europe.  Question is, exactly when will Greece default or issue the devalued Drachma?

SP futures are back again to their 30-minute M/A with another, longer M/A converging.

5/25 9:40

Stock futures fell overnight, breeching DJ daily M/A.  The supports for this market are slipping away.  The durable goods report did little to help, putting the lie to an economic recovery fueled by anything else than fiat money. 
My last pin under this market is the I1 component cycle, which I hope has abolished the lead from the quake.  If so, the stock market will at least tread water here for a few days.  However, every time SP futures rally up to their 30-minute M/A they are turned back, without even a significant penetration.  This is the first resistance that has to fall for a last-gasp rally to gain any traction.
My job is to get out of the way of I1, which is down.  The 30-day I1 has a trigger level coming up on it's crossover of 6.5.  This is about the timeframe for the I1 component cycle and silver to top.

Tuesday, May 24, 2011

5/24 Daily Commentary

SP futures tested their 30-minute M/A several times and in the afternoon finally fell back.  DJ daily M/A is the only M/A holding back the decline.  A support zone extends down to 12,250 basis June.

My goal is to be there when a substantial decline occurs.  If the 8-day lead has been eliminated then the following chart shows rally and the market will post a temporary bottom and rally, at least for several days:

Pima posted a question as to why the quake would induce a lead into I1 that has not occurred in the past several years.  Since I1 reflects instinctual behavior my theory is that the mind operates at different frequencies at different times.  These are expressed as actions according to natural cycles.  The reason that I present cavaets about the cycle charts is that they reflect fixed cycles looking backward for positive correlation.  Fixed cycles do not express the human dynamic, which is why various cycles operate, then cease to operate, then operate once again.  I1 projects the frequency of the moment for the mass as it reacts to it's environment.  The Japan quake threw off the operating frequency to a different one temporarily and the mass responded to environmental inputs using a different cycle.  That's how I see it.  Moving averages reflects these cycles as well, but we don't know in advance if a particular moving average will operate in the current environment.  All we have is the probability that it will.  When a moving average begins to operate in real time it tends to operate for the remainder of the trend, however long that is.


I'm holding only the short mutual funds.  Silver is rallying hard and projected to nearly $39 (38.65 green line).

5/24 10:30

SP futures have been testing their 30-minute M/A with only a minor throwback so far.   Sold 2% SDS at 20.80.

5/24 pre-open

The stock market rallied overnight as expected.  Right now SP futures are testing 30-minute M/A but should break through today to form a weekly rally.  I've got my "squirrel" position of nuts, 1% UCPIX, 1% SOPIX.  I'll be selling the 2% SDS today.

Gold is on it's way to another high and silver is on it's way to $39.
All is right with the world.

Monday, May 23, 2011

5/23 Daily Commentary

Currently hold 2% SDS, 1% UCPIX, 1% SOPIX.
The solar/lunar component of I1 has had an 8-day lead since the Japan quake in mid-March.  This cycle appears to have broken the lead and returned the series to synchronicity.  It topped with the market earlier this month, declined into it's trough, and will advance past +2 tomorrow.  This is a buy signal, so if the market starts a one-week rally overnight/tomorrow then the lead has disappeared from the series.  This will make my forecasting job easier for the short-term moves in the future.


I posted this morning that DJ futures would remain normal if they did not decline below 12,312.  Their low was 12,311, so this M/A envelope held and, given the I1 component and precious metals ready to rally, should provide an opportunity to short for a 2-month move into August.  Today's decline overlapped the prior high in April, so I know we are not in a 5 up to new highs. 

The checklist for the current market status is as follows:
1)  DJ critical M/A is on sell.  Currently 12,490 overhead resistance.
2)  SP futures 30-minute M/A is on sell. Currently 1325.75 overhead resistance.
3)  I1 30-day is on sell
4)  Cycles are on sell

The bullish forces for the stock market are:
1)  Short-term oversold
2)  DJ daily M/A
3)  I1 component bottomed today
DJI cash 50-day chart:

I'm not in a rush to load up on shorts because bull markets die hard.  I want a last-gasp rally off of support. 
Over the weekend I updated the Longer Signals using Time Elevations with an averaged version of this series.  The raw version flashes sell next Wednesday while the averaged version is on a sell currently.

Silver cycle chart:
Here is the gold cycle chart:

5/23 pre-open

The solar/lunar timing model has exhibited an 8-day lead since Japan, but is returning to accuracy with today's decline.  If the decline bottoms today then it and the raw I1 will resume their synchronicity with the stock market.  This series' buy signal occurs on crossover above +2 which means today is bottom day.
DJ futures are testing their 50-day M/A with an envelope of 70 points.  Things are normal until they decline below 12,312.


Crude is getting crushed, while gold is down nominally.  Silver down 50c.  I still expect rallies in the metals this week.

Friday, May 20, 2011

5/20 Weekly Commentary

The stock market operated on a DJI critical M/A sell signal since Tuesday.  It rallied back to this M/A and found resistance there Wednesday, Thursday, and Friday.

On Friday a decline broke the SP futures 30-minute M/A at 1333.  The market rallied back to this M/A where I bought 2% SDS at 20.30 on a pre-staged order.  I was out working on connecting up a water tank when the 30-minute M/A was hit. 
If the market continues the decline Monday then I'll be convinced that the lead that has existed in raw I1 no longer exists. 
However, the 5 up remains in the SP and DJ futures, so the decline today could be the correction of the rally since Tuesday and another wave up remains.  I expected this wave b to be a triangle, which is common for b waves, but the market broke downward making wave b a double zigzag.  If the market does rally Monday then I'll expect the top on Wednesday. 

The longer-view of I1 peaked early May and has been declining ever since.  However, this 30-day average of I1 peaked at a high level and historically this allows for a secondary rally until it crosses under 6.5.  This occurs in 5 more sessions .  This is the end of the line for the stock market rally and does not imply rally until this occurs.  It does imply that the meat of the decline lies beyond the crossover. 

Earlier this year I posted a new series which reflected I1 components at abnormally high and low levels.  This was embodied in a diffusion index and a rule set was adopted which rendered signals on a longer term than I1.  This series, Longer Signals using Time Elevations, is still valid. and will generate a sell signal June 3.  I've improved upon this raw series by running a 15-day average with a new rule set.  This new series peaks and troughs with the market.  The latest chart for the new series shows a peak occurring at this time.

The bottom line is that the stock market is on the verge of a major decline.  I'll be increasing exposure this week.
One reason that I believe that a rally will develop early this week is that metals look primed for a bounce to relieve the dramatic oversold condition.  This bounce will drag stocks with it.  The PM1 longer-term forward sentiment gauge remains pointed firmly down.  However there is a cycle in silver that still has a couple of days up left and gold looks like a new high this week with a strong cycle input.


At this point I'm holding back going heavily short the stock market.  I still have my short mutual funds and 2% SDS. The rollover to a substantial decline is imminent and I'm playing brinksmanship.

5/20 11:00

Got the 30-minute sell.  I'll look for a rally attempt to buy short ETFs. 

5/20 10:32

Still no 30-minute close below 1333.25.

5/20 10:01

30-minute M/A has not been broken. The 30-minute close was 1333.75, must be 1333.25 or lower.
Chart traders are short on the breakout from the triangle.  However, an Elliott triangle is not like Edwards and McGee.  The requisite 5 waves are complete and Elliott only allows an upside resolution, even though the 5th wave exceeded the low of the triangle formation.  Rallying from here would hand the chart traders a loss and be ideal for the larger traders to score.  Until 30-minute close at 1333.25 (preferably below) I'm sceptical.

5/20 9:35

Coming into today with just the core short mutual funds in trivial amounts, 1% UCPIX, 1% SOPIX.
DJ, SP futures count 5 up and in triangles for a b wave.  DJ has stalled at 90-minute M/A.  Looking for top 3/25 (next Wednesday) based on raw I1 lead.  An unexpected decline from here through Monday would mean that the lead is eradicated and the series returns to normal.  12,538 will be the alert for a downwave.

SP futures are also at 90-minute resistance, but are at 30-minute support as well.  They have completed the necessary 5 internal waves of a triangle, meaning that rally is iminent.  A 30-minute close beneath 1333.25 would confirm downwave in progress.

I'm still expecting a silver retracement to $39 to go short once again.  When the tide goes out it will take stocks and commodities.

Thursday, May 19, 2011

5/19 Daily Commentary

5 up since Tuesday's low going into triangle for SP and DJ futures. 
I'm assuming a 3-wave up from here. 
A similar count, though not as plain, exists in DJI cash.  The critical M/A is at 12,553, plus a 1.35% envelope, breaks at 12,725. 
DJ futures declining below 12,538 will alter this count.  Still waiting on silver to rally back to $39 and commodities in general to drag stocks back up.

5/19 2:10

What appears as wave c (or (iii)) is in progress.
The b wave was sharp and short but declined to prior 4th wave low and M/A support.  As long as the stock market is rallying the dollar and bonds are under pressure.  I'm still waiting for silver to rally and the stock-commodities synergy to develop.

The FOMC meetings are political shows.  Reasoning behind votes is sparse and discussion of the real issues occurs off-record.  There is no mention of the increasing risk to the Fed balance sheet and the difficulties they will encounter if the private marketplace liquidates bonds before they do.  Likewise there is no mention of the high prices paid for the treasuries and the potential for loss in the first place. Maybe they really believe that they can control the long end of the yield curve.

5/19 noon

The stock market has finished it's 3 wave down.  Any new low DJ futures below 12,510 indicates that the last 2 days' 5 up was but part of a larger 3-wave and that a new downleg is in motion.  I consider this low probability and expect a rally from here.

5/19 10:30

The stock market had a quick 3 down correction which took DJ futures back to their 10-minute M/A which I sold short ETFs into.
This could develop into a deeper correction but I am flat ETFs at trivial losses.   If the market continues to rally after this 5 up then I expect a top on the 25th.

5/19 10:13

Sold 4% SDS at 20.28, 2% TWM at 42.05, 2% QID at 49.60.

5/19 10:00

Stock futures completed 5 waves up last night.  Cash indexes just completed theirs to match. With an extension of the rally at hand after a downward correction of the 5 up, it appears that the I1 lead is still in effect for a top on the 25th.
Silver needs to retrace it's big 5 down to about $39.  Silver will accompany other commodities and boost the stock market on it's way to $39.

5/19 8:35am

Claims were down a bit which caused a knee-jerk mini-rally.  I'll exit short ETFs on the DJ futures 10-minute M/A, currently 12,542.

5/19 pre-open

SP, DJ, and ND futures all completed a 5 up overnight.  I'll wait for the pullback and sell the short ETFs.
It's snowing here...mountain weather.

Wednesday, May 18, 2011

5/18 Daily Commentary

The market declined Tuesday to daily M/A and trendline support and I sold all of my short ETFs near the lows.

I came into today with no short ETFs, 1% SOPIX, and 1% UCPIX.  I posted that I was waiting for a return to the DJI critical M/A. 
 I shorted a small amount just above 12,535 and more at 12,550.  The market posted a strong day with breadth 3-1.  This does a good job of scaring off bears, so the chart traders that shorted the breakdowns 2 days ago covered today.
SP futures rose to their 90-minute M/As and hovered there at the cash market close.  If futures put in a 90-minute close 6 points above this M/A then it increases odds that trend has changed to the upside.


I'm riveted to analysis of I1 and it's solar-lunar timing cycle which may be breaking from the 8-day lead that manifested itself last month and returning to it's normal accuracy.  The following series registers a buy on bottoms or +2, whichever is greater.  It registers top on peaks or 10.5, whichever is lesser.  Thus a peak that occurs at +12 will not register the sell signal until it returns back below 10.5.  This series has displayed an 8-day lead since Japan as indicated on the chart.  However, in the current cycle it registered it's latest sell signal by declining below 10.5 on Monday, which was correct.  If the market declines into Monday then the lead will have disappeared and this series (and I1) will be synchronized
with the stock market once again.  If the market continues to rally into 3/25 then the lead remains. 

                            
Here is the I1 which displays a similar lead: