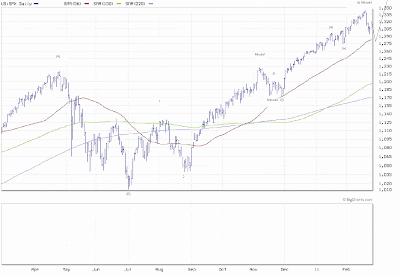
The current wave count from the 3/2009 low is complete according to the following labelling:
The I1 top date is 3/25 and is the highest probability for final top. This would allow for a month of topping/churning before the turn down.
It is also possible for the stock market to extend to the I1 top dates of 3/25 and 4/19, thus forming a 9 wave up sequence with 5 waves (Minute1 through Minute5) belonging to it's 3rd. This is not the highest probability but I'll address it here as a contingency.
This would allow for the Minute4 wave to terminate on another downwave to 1280 and Minute5 to finish by 3/25 at, let's say, 1380. The problem then becomes time, as wave 4 would likely be a rectangle and completing a wave 4 rectangle and the wave 5 finis by 4/19 is not tenable. It would require until mid-May for this to fit into normal Elliott "look". Luckily I1 allows for higher markets until 5/16. This is the day of the formal I1 sell signal when I1 starts it's fall to lower levels (below 3.25).
Corresponding to the following wave labelling:
Subscribe to:
Post Comments (Atom)


Steve,
ReplyDeleteI just wanted to write a quick note of thanks. I have learned a great deal from your blog and I appreciate your regular updates.