The stock market went nowhere last night and most of today, building what turned out to be a wave 4 rectangle. The breakout caused me to revert back to an alternate wave count.
Notice the 220-day M/A crossing 10,330. This M/A is one I use often and has a "gravity well" of 150 points. This means it's resistance envelope extends to 10,480.
The futures markets were making new highs to complete s5, waveC, and Minute2 after the cash market closed, but the futures markets close on Friday at 4:15 ET and the move had a bit more to finish up. I am flat futures having been stopped out on the early stages of the rally, but will enter short futures Sunday. SP futures closed at 1101 and have both daily and weekly resistance clustered at 1109. I don't think it will extend that high, but that is my worst-case.
Here are some gratuitous charts showing the SP and ND futures already at new highs but the DJ not quite there yet:
Here are the I1 values:
20100720 36.27178
20100721 36.41742
20100722 36.30637
20100723 34.96335
20100726 33.57488
20100727 32.35731
20100728 31.96437
20100729 31.80197
20100730 31.94768
20100802 33.12613
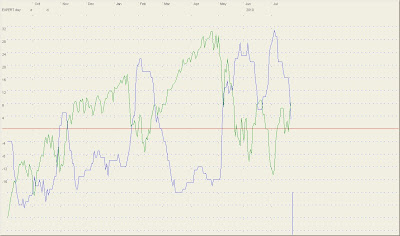
The daily technical composite declined to +3, thus rescinding the buy signal it has been on since peaking at +31 July 2. This clears the way for the decline to commence.
One of the reasons that I expect the stock market to start behaving worse than the I1 from here on is that I compute a 4-year cycle in such a way that 11/1/2010 is the projected bottom and the cycle accelerates as it progresses. We are now entering the stage where the acceleration will override other market forces.


No comments:
Post a Comment