I got called away on family business this afternoon. Liquidated stock position before I left but did not update the model position, so it stands at 5% SSO.
ADP data indicates that the economy just cannot get traction.
Wednesday, March 31, 2010
3/31 12:20
Another busy day, driven by market volatility. The ADP number indicates Friday's jobs number will not be the blowout that economists expected.
Staying 5% long as per prior posts. Stop is DJI 10,850.
Here is current wave count:
 Correcting an error in the 10:45 post:
Futures 30-minute 92-unit M/A +/-.5% should read:
Futures 30-minute 92-unit M/A close +/-.5%
With futures markets I compare the M/A with the price at then end of the M/A period in order to accomodate the increased volatility (stop-running, etc).
With this calculation the price stayed well within it's envelope. Instead of:
The futures M/A spread to its low was 1168.75 M/A - 1161 low = .66% which is outside of its envelope.
it should read:
The futures M/A spread to its 30-minute low close was 1168.75 M/A - 1163.80 = .42% which is inside of it's envelope (.5%).
So, all of the M/As that I use for stops are OK to stay long.
Staying 5% long as per prior posts. Stop is DJI 10,850.
Here is current wave count:

Futures 30-minute 92-unit M/A +/-.5% should read:
Futures 30-minute 92-unit M/A close +/-.5%
With futures markets I compare the M/A with the price at then end of the M/A period in order to accomodate the increased volatility (stop-running, etc).
With this calculation the price stayed well within it's envelope. Instead of:
The futures M/A spread to its low was 1168.75 M/A - 1161 low = .66% which is outside of its envelope.
it should read:
The futures M/A spread to its 30-minute low close was 1168.75 M/A - 1163.80 = .42% which is inside of it's envelope (.5%).
So, all of the M/As that I use for stops are OK to stay long.
3/31 10:45
Sold 5% SSO at 42.19. Hit the SPX 15-minute 54-unit M/A.
Quick trade. Look to re-enter at DJI 10,860.
There are stock market 3 M/As that I rely on:
Futures 30-minute 92-unit M/A +/-.5%
SPX cash 15-minute 54-unit M/A +/-.56%
DJI 5-minute 380-unit M/A +/-1.2%
I have tactics surrounding all 3.
The SPX cash M/A was broken at the open at 1172.57. Subtracting .56% leaves 166. SPX hit 165.77. I normally give 20 ticks so this is within the envelope.
The futures M/A spread to its low was 1168.75 M/A - 1161 low = .66% which is outside of its envelope.
On the plus side the market has made a 5-wave advance off the low, so I definitely want to get back in.
3/31 10:00
Had the 5-wave decline ended below yesterday's low I would have declared it the bottom of wave 2. Because it was not then there was more decline to follow.
Bought 5% SSO 41.84 at end of extended 5-wave. Stop at SPX 1165.70.
Here is the chart of the wave 2 decline since yesterday:


Bought 5% SSO 41.84 at end of extended 5-wave. Stop at SPX 1165.70.
Here is the chart of the wave 2 decline since yesterday:

Here is the wave 1 and wave 2, pointing to advance from here:
3/31 9:35
5-wave decline, selling 7.5% SSO at 42.10 for a profit.
9:40 Sold SSO at 42.10. Sold DDM at 48.
9:40 Sold SSO at 42.10. Sold DDM at 48.
3/31 pre-open
ADP private-sector payrolls came in negative. This indicates the jobs report will not be as spicy as economists estimates. 100,000 census workers are baked into Friday's number. Without a positive private-sector number to add to that the jobs report becomes a non-event.
Coming in long due to uptrend I1. Stop is at June futures < 1162.70. 30-minute M/A is 1168.75:

Coming in long due to uptrend I1. Stop is at June futures < 1162.70. 30-minute M/A is 1168.75:

.5% of 1168.75 minus 20 ticks = 1162.70.
Tuesday, March 30, 2010
3/30 Daily Commentary
Busy day, driven by market activity.
Recap: Came into today 2.5% long DDM at 47.91
Bought another 2.5% DDM 48.02 ARCA due to overnight confirmation 30-minute S&P futures.
Sold 2.5% DDM at 48.35 because the 5-wave from Thursday's low was completing.
Bought 5% SSO at 42.11 on return to SPX 15-minute 54-unit M/A
Bought another 2.5% SSO at 41.97 on return to critical support, DJI 5-minute, 380-unit M/A.
Currently 10% long stock market.
Here is current count:

Any decline below 10,720 will force me short.
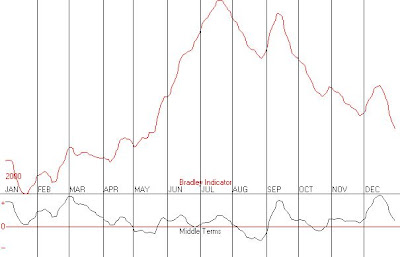
Got a comment that I1 turn dates are similar to Bradley Siderograph. I don't incorporate Bradley into I1, but it does include solar and lunar events (full/new moons, eclipses, even sunspots). However, I1 also includes atmospheric, oceanographic, and weather data.
I looked into Bradley many years ago but determined it's deficiencies were:
1) Turn date consistency was not good enough to rely upon.
2) Turn dates frequently inverted (that is, what was a top in Bradley turned out to be a bottom in prices) and the inversion was not detectable until well after the event because it's base reliability was not high enough to filter a bad turn from an inversion.
3) The values did not correspond to the degree of the move when it did work.
All of these objections are not valid with I1. Point 3 means that buy or signals based on levels of values are non-existent in Bradley but are the most important feature of I1. I1 is the only reason that I have been making money over the past several years, after 20 years of spotty results (I admit it, even the good years were not great). I pretty much abandoned almost all technical indicators and cycles. This simplified my work as well and left me more focused.
Here is Bradley followed by I1 for each year from 2000 through 2007. (It is time-consuming converting graphics for comparability and uploading data.):
2000:


Recap: Came into today 2.5% long DDM at 47.91
Bought another 2.5% DDM 48.02 ARCA due to overnight confirmation 30-minute S&P futures.
Sold 2.5% DDM at 48.35 because the 5-wave from Thursday's low was completing.
Bought 5% SSO at 42.11 on return to SPX 15-minute 54-unit M/A
Bought another 2.5% SSO at 41.97 on return to critical support, DJI 5-minute, 380-unit M/A.
Currently 10% long stock market.
Here is current count:

Stock market completed the 1st and 2nd waves this morning . That gives Mr. Market plenty of time to complete waves 3 and 4 by close Thursday. Monday a pop higher will complete the 5 wave and provide a shorting opportunity. This is speculation at this point but it can serve until proven wrong.
Any decline below 10,720 will force me short.
Got a comment that I1 turn dates are similar to Bradley Siderograph. I don't incorporate Bradley into I1, but it does include solar and lunar events (full/new moons, eclipses, even sunspots). However, I1 also includes atmospheric, oceanographic, and weather data.
I looked into Bradley many years ago but determined it's deficiencies were:
1) Turn date consistency was not good enough to rely upon.
2) Turn dates frequently inverted (that is, what was a top in Bradley turned out to be a bottom in prices) and the inversion was not detectable until well after the event because it's base reliability was not high enough to filter a bad turn from an inversion.
3) The values did not correspond to the degree of the move when it did work.
All of these objections are not valid with I1. Point 3 means that buy or signals based on levels of values are non-existent in Bradley but are the most important feature of I1. I1 is the only reason that I have been making money over the past several years, after 20 years of spotty results (I admit it, even the good years were not great). I pretty much abandoned almost all technical indicators and cycles. This simplified my work as well and left me more focused.
Here is Bradley followed by I1 for each year from 2000 through 2007. (It is time-consuming converting graphics for comparability and uploading data.):
2000:

2001:

2002:

2003:

2004:

2005:

2006:

2007:

3/30 2:30
Stock market has completed wave (i) and (ii) plus wave i and 2 of (iii) and is rallying (SPX now at 1174):


No change to stops. I1 due to peak in several days. Currently 10% long and wanting to sell half at 10,950 DJI.
3/30 1:15
Nasdaq composite shows the 5-wave up the best:


Would not surprised if I saw a decline to 2402 before the advance continues.
3/30 12:20
Recap: Came into today 2.5% long DDM at 47.91, bought another 2.5% DDM 48.02 ARCA due to overnight confirmation 30-minute S&P futures. Sold 2.5% DDM at 48.35.
Bought 5% SSO at 42.11, bought another 2.5% SSO at 41.97. Currently 10% long stock market.
Stock market counts 5-wave complete off of this morning's bottom:


Bought 5% SSO at 42.11, bought another 2.5% SSO at 41.97. Currently 10% long stock market.
Stock market counts 5-wave complete off of this morning's bottom:

Current stop sell 5% SSO at SPX<1168.40. Sell the remaining SSO and DDM at SPX<1164. 1164 is the support from .56% below SPX 15-minute, 54-unit EMA:

Showing profit on trade with uptrending I1, Elliott wave count supportive, and bought at critical support DJI 5-minute, 380-unit M/A.
3/30 11:30
Stock market just hit critical support. Bought another 2.5% SSO at 41.97:


I count the 3-wave corrective phase complete:

Initial stop-loss order just under here at SPX 1168.40 for 5% SSO. Currently am 10% long, 2.5% DDM and 7.5% SSO.
To recount, I have an uptrending I1, a completed 5-wave, and market at critical support. Good combo.
3/30 11:00
Stock market completed the 1st wave this morning. That gives Mr. Market plenty of time to complete the wave 2 decline today and complete wave 3 and 4 Thursday. Monday a pop higher will complete the 5 wave and provide a shorting opportunity. This is speculation at this point but it can serve until proven wrong.
Any decline below 10,720 will force me short.
Any decline below 10,720 will force me short.
3/30 10:30
Just completed a 5-wave. Looking to buy lower:


Update 10:45 Entering order to buy 5% DDM at SPX 1171.10. It will take more time to trace out a correction here. The good new is that by completing a 5-wave I have another confirmation of upcoming advance after the corrective phase completes.
3/30 10:00
Stock market rally has another confirmation by advancing .56% beyond the 15-minute 54-unit M/A:
 Last night the June futures advanced .5% beyond the 30-minute 92-unit M/A (blue line):


No stop order as of yet.
3/30 pre-open
S&P futures confirmed uptrend by advancing past 1171.50. They have since fallen off. I bought another 2.5% DDM at 48.02 on ARCA. This brings me up to 5% long stocks.
Will buy another 2.5% if SPX cash declines to 1171 after the open.
Not interested in silver or oil until dollar index bottoms out in a few days.
Will buy another 2.5% if SPX cash declines to 1171 after the open.
Not interested in silver or oil until dollar index bottoms out in a few days.
Monday, March 29, 2010
3/29 Daily Commentary
I am long the stock market. Confirmation will come when June futures exceed 1171.,50, hopefully tonight.
Dollar peaked short-term, so until dollar index declines to 80 then commodities will advance. This will put a tailwind behind the stock market. See the 10:00 post for more. I1 peak on 4/2 on Good Friday means I will go short Monday morning, hopefully on a rally. Prior to this date any decline below DJI 10,720 will force me to go short. I do not expect this to happen.
Jobs report Friday will be a positive number, expecting 200,000. Of these 100,000 will be census workers. This will not diminish the buzz. Past stimulus means current economic uptick. The stock market sniffs out future sources of liquidity. Whether that liquidity is public sector or private sector, short-term or secular, it provides the tailwind or headwind for the stock market. Where will future liquidity come from?
Ultimately, liquidity waxes and wanes with human psychology, the propensity to risk capital on future outcomes. On the corporate side, investment in plant and equipment causes liquidity to increase as this capital multiplies through the economy. The bricks and mortar side of investment is pretty much gone in the U.S. The cost disadvantages of building plant and paying workers and government prohibits the decision to locate new plant in this country. This has become even more prevalent given recent government actions to increase the costs of workers and taxes going forward.
How about tech spending? I spent a lifetime in Information Technology. The payoff of increased tech investment has been declining for a decade. The liquidity boost in the economy is in the multiplier, not the initial investment. The lower the bang for the buck then the lower the multiplier.
How about the consumer side? The fervent hope of Treasury and Fed is that by supporting mortgage markets they can cause citizens to take the mortgages off of their books. Even with the trillions thrown in and a year and a half to gain traction, these investments are still underwater. Boomers are not going to borrow, even those that would pass credit muster, because they are at the lif-cycle stage where reducing debt is a prerequisite for saving for retirement. Other segments of society are either bad credits or in debt-reduction mode for the next several years.
On the commercial side, by buying CMBS they hope to minimize the decline not only in the CMBS market but in the prices of properties themselves. Again, it has been a year and a half and the commercial crisis is now hitting a broad swath of financial institutions. By not allowing the commercial market to clear the government is keeping low-priced properties off the market, which could increase the efficiency of potential leasees/purchasers. Government is committed to preventing American business from coming back to international competitive advantage.
3/29 1:00
Critical support is at 10860. Resistance is at 1171. Will buy if 1171.50 is hit or if DJI = 10860.
Market movement since low Friday is a 3-wave with current juncture being wave 4 or a completed abc with down wave ahead. I believe it will resolve to the upside, breakout above 1171.50 in accord with I1.
It is about time to update the longer wave counts. Here is the Nasdaq QQQQ for the past three months. A wave 5 is ahead to complete the move from March, 2009 as ABC upward correction:

3/29 noon
Will hold long stocks and avoid short until Monday 4/5. 4/2 the I1 peak date falls on Good Friday. Will sell stocks Thursday at the close and go short early Monday morning.
As of today, the stock market has not confirmed breakout by June futures exceeding blue line + .5%, which is 1171.5. I will not increase exposure until this is achieved. The next milestone is cash SPX, which will be discussed later. Here is the 30-minute futures M/A:

As of today, the stock market has not confirmed breakout by June futures exceeding blue line + .5%, which is 1171.5. I will not increase exposure until this is achieved. The next milestone is cash SPX, which will be discussed later. Here is the 30-minute futures M/A:

3/29 10:00
Dollar peaked on time Friday. Followed dollar to reduce silver exposure Friday. Will ignore declining silver forward sentiment until stock sentiment peaks (4/2, with holiday, Thursday or Monday).
Here is dollar forward sentiment (I call it DXcom) updated from the one posted last week:

Confirmation of stock market rally will be with futures 30-min M/A + 6 points. If June futures can exceed 1171.60 I can increase stock long position.
Here is dollar forward sentiment (I call it DXcom) updated from the one posted last week:

So, dollar on a decline over this week or until 80.00 is reached. This is bullish for commodities. I1 also has positive correlation with silver and oil, but not as strong as their optimized forward gauges. So, I got confirmation as to which gauge the market was going to follow. Should have known, with uptrending I1 and downtrending dollar gauge (DXcom), that commodities were set to rally. Will not short crude or silver until I1 turns. Anticipating stock market rally this week to discount positive job report.
I am long stock market with 2.5% DDM. This has already offset stop-out in short silver. Sold tiny position of ZSL at 4.20.Confirmation of stock market rally will be with futures 30-min M/A + 6 points. If June futures can exceed 1171.60 I can increase stock long position.

Sunday, March 28, 2010
3/29 pre-open
I went into the weekend flat the stock market looking to buy an expected breakout to the upside today (SPX exceeding 1168.75). Bought 2.5% DDM at 47.91 on ARCA. Went in with the absolute minimum position short silver 1.5%. Bought tiny silver futures based on stop being hit. Will sell ZSL near market open.
The jobs number is estimated at 190K - 200K. The stock market will be discounting this number all week. It is higher than any in the past 2 years. A lot of buzz will surround it Friday and Monday. No trading Friday.


The jobs number is estimated at 190K - 200K. The stock market will be discounting this number all week. It is higher than any in the past 2 years. A lot of buzz will surround it Friday and Monday. No trading Friday.

So, current economic statistics are looking up! Unfortunately, to make money in the markets you need to look 6 months down the road. A look at M3 is a heart-breaker. The government has been trying to get the money supply to expand and it can't! This is after 1.6T added to Fed balance sheet and monetary base, stimulus bills through Congress, bailouts of nefarious institutions along with a few victims, and nationalizing of financial instutions and car companies. Look at this M3. It says it all:

And, lest you think that M3 is not relevant, the history leading into 2008 was a lion's roar right up to the market's top. The reason that the government cannot get money supply to expand is because the recession has not cleared out the extreme level of debt in the system. Thus, people will not lend to others without impeccable credit and people will not borrow because they are concerned with getting out from under their extreme level of debt. So, the only difference between now and pre-2007 is that the government has assumed the role of drunken sailor, instead of it being shared between the private and public sectors. The points to take home are:
The stock market discounts FUTURE liquidity, not current liquidity.
The spreads in the debt market have shrunk to downright complacency!
Rates are going up but are not (yet) affecting spreads and junk is back.
Complacency is also apparent in stock market sentiment and this does not bode well for future prices.
I got some feedback that my statement Friday that I thought that the stock market was built on lies was over the top. I wish to apologize if I offended anyone. The truth is that our economy and markets offend me. They offend my moral compass. Citigroup, Goldman Sachs, Bank of America and others created, fostered, and prospered by the derivative shell game and have been prime beneficiaries of the government bailout. Goldman Sachs benefited mightily even though it did not receive direct monies, but it's blatant misuse of the public sector as well as cheating financial institutions around the world by use of it's derivative products places it in a unique place amongst the amoral icons of history. So yes, I am offended by the stock market and the financial system in general, which I believe is still in precarious condition by virtue of all being saved.
Friday, March 26, 2010
3/26 Addendum Is 4/2 THE high?
A lot of people have been asking if 4/2 (4/1 because of Good Friday) will be the top of this stock market. This top is a I1 sell signal lasting at least through 4/12.
The long-term forecast as laid out in 2010 Forecast contains the following:
My longer-term forecast is predicated on I1 values which, from 5/2010 through 5/2015 will contain only 7.25 months with I1>4, averaging 1.43 months per year. I1=4 is considered a balance point and historically the market averages 7 months per year >4.
To put this into perspective the only other extended bear market was 1966-1974.
The bear market decade of 1966 through 1974 had a total of 13.5 months with I1 values > 4, averaging 1.5 months/year. I1 stayed below 4 from 7/12/1999 through 5/5/2003 (the I1 bottom was earlier at 2/10/2003). Even the most recent bear market from 6/2007 through 3/2009 contained 5.25 months with I1<4, averaging 3 months per year.
So I1 is calling for a prolonged bear market with sub-par I1 values through 5/2015.
The last I1 selling point prior to May of this year is 4/22. My opinion is that the acceleration phase will begin at this point.
The details from this time forward are:
4/2 is a I1 signal lasting through 4/12
4/13 to 4/21-4/28 is some kind of recovery, probably not retracing the prior decline.
4/22-4/29 Top. the bear begins in earnest leading into a prolonged period of suppressed psychology
Here is the current I1 chart extending through November, which includes the entire 1st leg of the upcoming bear market:

The period 5/2010 through 5/2015 will witness almost continual depression of psychology.
The current expectation of economists is at variance with this thesis.
The spreads between lower-tier and upper-tier credit have returned to normal. This has some economists making optomistic forecasts. The spreads are strictly due to Fed and Treasury support for entire pillars of the debt market. The bad assets have not been cleared, as has happened in ALL prior recessions. Hence, the spreads absent government intervention should be wider than they currently are. The markets will rediscover the bad assets in future earnings reports.
Another fallacy in economic thought is the "normal" trajectory out of recession, as determined by prior recessions. Economists concede that employment will remain higher than after prior recessions, yet they insist that 2011-2012 will take us back to higher growth rates. However, the American economy has been permanently relegated to a service economy dependent on government spending. In this new world incremental prosperity is disappearing as high-paying jobs are supplanted by low-paying jobs. The government(s) employment has been growing rapidly but has hard limits on how much of the workforce they can employ (short of communism). High unemployment is a systemic issue, not a transient one.
Finally, I believe that most people realize that this government will not return to fiscal balance. That being said, the forces for budgetary restraint will gain an upper hand over the next several years. Thus, trillion dollar deficits will start to become a political third rail. While any hope of balanced budgets is a fairy tale the stim will be off the rose (real spending net of interest payments will start to decline). This is fiscal drag even with budget deficits. Interest payments are not inflationary. Social Security payments are not inflationary. The health care bill is inflationary but will be partially offset by spending cuts in other areas as it becomes politically gauche to launch new programs in the future. The U.S. interest rate on public debt will force interest costs up going forward and this will apply pressure to find budget cuts to offset.
Only after years of budget-cutting will the Fed be turned loose to monetize more debt. The Fed monetized $1.5Trillion boosting its balance sheet with mortgage-backed securities. They will not be disposed to undertake another round for a long time. Congress will not be disposed to see the Fed expand its balance sheet and is currently sitting on the Fed's shoulder threatening to peck their eyes out. Thus, the inflationary impact of the Fed's folly has already been felt in the gold/silver market and the dollar. The dollar's rally off of the December lows puts a nail in the coffin for continued monetization.
More in future posts....
The long-term forecast as laid out in 2010 Forecast contains the following:
My longer-term forecast is predicated on I1 values which, from 5/2010 through 5/2015 will contain only 7.25 months with I1>4, averaging 1.43 months per year. I1=4 is considered a balance point and historically the market averages 7 months per year >4.
To put this into perspective the only other extended bear market was 1966-1974.
The bear market decade of 1966 through 1974 had a total of 13.5 months with I1 values > 4, averaging 1.5 months/year. I1 stayed below 4 from 7/12/1999 through 5/5/2003 (the I1 bottom was earlier at 2/10/2003). Even the most recent bear market from 6/2007 through 3/2009 contained 5.25 months with I1<4, averaging 3 months per year.
So I1 is calling for a prolonged bear market with sub-par I1 values through 5/2015.
The last I1 selling point prior to May of this year is 4/22. My opinion is that the acceleration phase will begin at this point.
The details from this time forward are:
4/2 is a I1 signal lasting through 4/12
4/13 to 4/21-4/28 is some kind of recovery, probably not retracing the prior decline.
4/22-4/29 Top. the bear begins in earnest leading into a prolonged period of suppressed psychology
Here is the current I1 chart extending through November, which includes the entire 1st leg of the upcoming bear market:

Although the data after September is estimated, it is a good estimation process. As can be seen sell signals are rendered into lows in June, July, August, September, October, and November. My estimated bottom date is 11/18. So, 4/2 is the first in a long string of official sell signals (I1 bottom < 3.25). This defines a bear market. This can be verified by inspecting the historical charts in Intro and Concepts. 3/5 did not define the top, there was no sell signal. Since there was no sell signal my exposure was tiny. My initial foray into shorting the market rally resulted in 1% impact on capital. My exposure at the close 4/1 will be 15% of capital because it is a high prior to a decline below 3.25. This will be increased to 30% when DJI breaks its 5-minute, 380-unit M/A. Of course, if the DJI breaks this level beforehand then that will be the intial entry point at 15%.
During this time, try as they might, nothing the government does will yield fruit, only increasingly bitter reaction. This psychology will extend to corporate management, which at this time is already fairly conservative. As the decline proceeds their investments in equipment and software will pay negative returns causing even greater retrenchment. Economists are happy with 3% growth second half 2010. That is not real growth, but nominal growth. My take is less than 2.5% growth.
The period 5/2010 through 5/2015 will witness almost continual depression of psychology.
The current expectation of economists is at variance with this thesis.
The spreads between lower-tier and upper-tier credit have returned to normal. This has some economists making optomistic forecasts. The spreads are strictly due to Fed and Treasury support for entire pillars of the debt market. The bad assets have not been cleared, as has happened in ALL prior recessions. Hence, the spreads absent government intervention should be wider than they currently are. The markets will rediscover the bad assets in future earnings reports.
Another fallacy in economic thought is the "normal" trajectory out of recession, as determined by prior recessions. Economists concede that employment will remain higher than after prior recessions, yet they insist that 2011-2012 will take us back to higher growth rates. However, the American economy has been permanently relegated to a service economy dependent on government spending. In this new world incremental prosperity is disappearing as high-paying jobs are supplanted by low-paying jobs. The government(s) employment has been growing rapidly but has hard limits on how much of the workforce they can employ (short of communism). High unemployment is a systemic issue, not a transient one.
Finally, I believe that most people realize that this government will not return to fiscal balance. That being said, the forces for budgetary restraint will gain an upper hand over the next several years. Thus, trillion dollar deficits will start to become a political third rail. While any hope of balanced budgets is a fairy tale the stim will be off the rose (real spending net of interest payments will start to decline). This is fiscal drag even with budget deficits. Interest payments are not inflationary. Social Security payments are not inflationary. The health care bill is inflationary but will be partially offset by spending cuts in other areas as it becomes politically gauche to launch new programs in the future. The U.S. interest rate on public debt will force interest costs up going forward and this will apply pressure to find budget cuts to offset.
Only after years of budget-cutting will the Fed be turned loose to monetize more debt. The Fed monetized $1.5Trillion boosting its balance sheet with mortgage-backed securities. They will not be disposed to undertake another round for a long time. Congress will not be disposed to see the Fed expand its balance sheet and is currently sitting on the Fed's shoulder threatening to peck their eyes out. Thus, the inflationary impact of the Fed's folly has already been felt in the gold/silver market and the dollar. The dollar's rally off of the December lows puts a nail in the coffin for continued monetization.
More in future posts....
3/26 Daily Commentary
Bought another short silver ZSL but sold this afternoon. Did not know about the Korea hubbub until 3:00, which explained silver's relative strength. Bought and sold for 4.38. Today was top day for the Dollar forward sentiment. Either the dollar gauge is wrong or the silver gauge is wrong. They cannot both go down over the next month. Can they???
Went short crude at 9:30 DTO 64.20 and held to exit at 65.80. Crude should have rallied with the scare but did not. I don't want to go short until either the stock market decline begins (I1 peaks or DJI declines<10,710) or Brent crude declines beneath 78....
Stock market retested yesterday's low this afternoon. Bought DDM long dow at 47.50 and sold at 47.70 and 47.64 later. Will re-enter on the long side if SPX rallies past 1168.75. I1 is up through next Friday, which is a holiday. If DJI declines below 10,710 then I will short early. Since this level is near an important low 10,695 I will await a bounce for a 5% position. 10,710 is below the important high 10,730.


Currently I am short silver 1.5% ZSL. Maybe metals will rally on war scare, in which case it will not hurt much. Silver stop is beyond the 90-minute M/A which is 17.10 on a 90-minute close.
Flat crude, flat stocks pending breakout.
Went short crude at 9:30 DTO 64.20 and held to exit at 65.80. Crude should have rallied with the scare but did not. I don't want to go short until either the stock market decline begins (I1 peaks or DJI declines<10,710) or Brent crude declines beneath 78....
Stock market retested yesterday's low this afternoon. Bought DDM long dow at 47.50 and sold at 47.70 and 47.64 later. Will re-enter on the long side if SPX rallies past 1168.75. I1 is up through next Friday, which is a holiday. If DJI declines below 10,710 then I will short early. Since this level is near an important low 10,695 I will await a bounce for a 5% position. 10,710 is below the important high 10,730.

In case you haven't noticed I rely a lot on moving averages. Hardly a stochastic or RSI in my toolkit. Here is another on that I use when the stock market is in a congestion zone (like this afternoon). The red line plus .19% should indicate breakout:

I despise this market. It's just built on lies and when the stim runs out and the lies cannot cover up underlying conditions it will fall a ton. So, even though I expect U.S. stocks to rally from here in accord with I1 and critical resistance, I do not want to carry stocks over the weekend. I'll play the breakout Monday. I won't be comfortable with the stock market until the green line is exceed by .56%. That is way far away.
Currently I am short silver 1.5% ZSL. Maybe metals will rally on war scare, in which case it will not hurt much. Silver stop is beyond the 90-minute M/A which is 17.10 on a 90-minute close.
Flat crude, flat stocks pending breakout.
3/26 3:48
Stock market is range-bound in 3-waves forming a base. Breakout will be at SPX 1168.75. Sold remaining DDM at 47.64 and will use breakout level tomorrow to re-enter on long side.
3/26 2:15
Here is the 150-minute M/A of DDM. Exited 1/2 at 47.70.

The rally off of the lows is a 3-wave. This is not disturbing, but it means that there is going to be backing-and-filling before any self-sustaining advance begins. Still bullish short-term, but wishing there was a 5-wave there.
Silver bothers me. It participated in this morning's stock market rally, but hardly at all in this afternoon's decline. Must be world events.
3/26 1:45
Sold 1/2 of the DDM long stock position at 47.70. It completed a 3-wave to the 150-minute M/A.


The decline from yesterday completed a normal 3-wave correction. This, with the I1 uptrend, leads me to expect higher prices from here. However, world events related to debt liquidation make me leery of long stocks. I keep telling myself that I1 is not on a buy signal, only an uptrend.
3/26 12:30
If I were to buy stocks at 10,852 I would place a stop at 10,817.

Crude hit my target of 65.80. 66 had stopped DTO multiple times in past week. Exited trade.
The silver 90-minute M/A is my best entry and exit. I was using the hourly M/A until the 90-minute M/A came down. It and silver kissed today, at which point I entered another 1.5% ZSL. My stop is now .7% beyond the 90-minute M/A, putting it at 17.10 on a 90-minute close:

3/26 12:20
Silver came back up to it's 90-minute M/A. I bought another ZSL at 16.37.


Crude stop drops to USO > 39.13. Target DTO 65.80
Stocks critical support at DJI 10,852. If you want to buy 'em that's the place to do it. This morning's rally was a 3-wave as was yesterday's decline. If you buy at 10,852 the stop is at 10,715.
3/26 11:40
Even though DJI got up to 10,909 it did not confirm wave v. It has been inching higher in 3-waves.
3/26 11:20
Stock market in wave iv, so if DJI breaks 10,908 then that will be start of wave v and the OK to buy. I am standing aside from the stock market.
Crude stop USO > 39.16, target DTO 65.80
Crude stop USO > 39.16, target DTO 65.80
3/26 10:30
The stock market is dangerous because it is technically overbought, sentiment is frothy, and the monetary tailwind is weakening (interest rates are going up around the world, counteracting stimulus). Against this the I1 is uptrending, but not on a buy signal which means that sentiment will be supportive to the peak but not overwhelmingly bullish. The market can go down in the face of I1 uptrend, but we will not have a crack-up until after the peak.
I am waiting for my moment to go short. In almost any other market environment I would have used yesterday's close at critical support to go long. I just cannot bring myself to do it here.
Crude trade is in the money, stop USO 39.22, exit DTO 65.84
I am waiting for my moment to go short. In almost any other market environment I would have used yesterday's close at critical support to go long. I just cannot bring myself to do it here.
Crude trade is in the money, stop USO 39.22, exit DTO 65.84
3.26 10:20

Stocks are at resistance now. Buy is only OK at .56% above this M/A. That works out to 1178.50. I just hate going long this market.
Crude had a quick tumble this morning, came back to the open, and has since turned back down. DTO high was 65.85, 5 ticks shy of my exit. Hanging in the trade. Stop at USO 39.22, exit at DTO 65.84.
3/26 10:00
Changing target for DTO to sell DTO limit 65.90.
Crude had an updraft at the open in concert with stocks, but crude's gauge topped yesterday. This was a nice short crude entry point.
There is a shelf of support at Brent 78. This corresponds to about 66 in DTO.
If Brent breaks 77.80 then crude has much farther to go on the downside.
Crude had an updraft at the open in concert with stocks, but crude's gauge topped yesterday. This was a nice short crude entry point.
There is a shelf of support at Brent 78. This corresponds to about 66 in DTO.
If Brent breaks 77.80 then crude has much farther to go on the downside.
3/26 9:40
Bought 100 DTO at 64.20. Yesterday was top day for crude forward sentiment. Target for quick trade is WTI spot 79.10. Stop USO > 39.22.
3/26 pre-open
Yesterday's decline stopped right at the 5-min 380-unit M/A. This is a classic re-entry point within an uptrending I1.

I can only see higher prices from here through next Friday, as only higher prices can tip my technical composite into a sell signal (-22).
Silver is currently 16.84 and has avoided triggering the hourly close stop at 16.89.

Silver is currently 16.84 and has avoided triggering the hourly close stop at 16.89.
Thursday, March 25, 2010
3/25 Daily Commentary
I did not go short crude again. I cancelled the order because at that time the stock market was closing in on critical support:

Silver closed up a bit, the stop stays at 16.89 on hourly close basis May futures. The following is a 90-minute chart May futures. My stop is based on hourly but the green line approximates the hourly with a 5c leeway on a closing basis.


1.2% below this M/A at 10,835 is 10,705. Give it 10 points cushion to 10,695. If the stock market breaks this level it will cancel the restriction to short due to the I1 uptrend. I do not expect this to happen. Since short crude was a way for me to put on a synthetic short stocks position, shorting crude at stock market support seemed like a stupid thing to do. DTO closed near where my fill would have been anyway. Made 50 ticks on DTO earlier.
Sitting on my hands waiting for I1 to peak seems unproductive to the untrained eye. Not much action. Not much research into individual stocks, flipping them throughout the day.
Trading is a learned behavior. The tenets of trading success (in my mind) are:
1) Have a way to look at markets that takes you far from the normal perspective. The more unique your perspective the more likely your long-term success. Independence in research and in strategy are key. The primary reason for this is that your opinion will not be a conscious or subconscious acceptance of the majority of analysts (technical, fundamental, talking heads, whatever, we pick up opinion from the media).
2) Discipline. Iron discipline in entry will allow a trader not only to wait for the opportunity but will allow him to stay with a trade. Staying with a trade requires discipline but truly separates success from failure. When I1 is not on a signal the number of markets I enter is far less. Don't look for action!
3) Learn to enjoy selling weakness and buying strength. This took decades for me to learn because to me it seemed counter-intuitive. Earlier in my trading career I would look for top tick, which itself was a gambling mentality. Now I use breaks of moving averages as entry and exit points. I never get in near the top or bottom. The only exception is when I1 is top or bottom signal day. Then I can go in near the close either choosing a logical point or market on close.
4) Prudent money management is a must, limiting exposure of any trade or markets with high correlation. I am sure if you look at the Trading History you will think I can never make any real money. 2.5% capital, 1.5% capital, etc. I do when I catch a trend and add to the position.
5) Have something else to do when your system tells you to sit on your hands. This can include market research, hobbies, working on the ranch, whatever gets you away from looking at your trading platform. The tendency to jump into trades is a bad habit that must be broken.

So, if 16.89 is exceeded on hourly close then I will wait for 17.07, the blue line, to re-enter the short.
Crude oil top day was today, but I will wait for a stock market rally to re-enter a crude short tomorrow.
3/25 3:00
Stock market hit support here. Should rally.
Support break at 1166.
Took profit in oil riding coattails of stocks. Will re-short USO<38.94 or USO>=39.18.
Support break at 1166.
Took profit in oil riding coattails of stocks. Will re-short USO<38.94 or USO>=39.18.
3/25 2:45
Crude is working out. Order to buy another DTO, double-short at USO=39.23. Stop at USO>=39.43.
Silver stop remains at 16.89 on hourly close basis May futures. Silver is unchanged.
Big support in stockmarket at DJI 10,840.
Silver stop remains at 16.89 on hourly close basis May futures. Silver is unchanged.
Big support in stockmarket at DJI 10,840.
3/25 2:00
Shorted crude via DTO at 64.01. Stop initially set as conditional USO>39.50 sell DTO. Will buy another DTO as USO=39.28 (if it retraces back that far).
3/25 1:15
Crude entry is now USO = 39.11.
Bonds are having another bad day, carryover from Portugal's surprise.
Stocks could have short-term top right here.
Bonds are having another bad day, carryover from Portugal's surprise.
Stocks could have short-term top right here.
3/25 12:15
Buying DTO if USO trades below 39.08. Crude has been tracking the stock market for awhile and stocks will complete a 5-wave up with one more thrust. Here is the crude forward sentiment gauge:


Today is top day in crude gauge. The entry point will be moving up as the afternoon progresses.
In the stock market the flash point in the DJI that would force me short is 10,700.
3/25 mid-morning
Stocks up, dollar flat, silver down 15c.
I1 up until 4/2. I will be forced to go short on DJI decline to 10,675.
Lowering silver stop to 16.89 on an hourly close.
Working on reconciliation of dollar forward gauge and silver and gold. The dollar gauge is declining from 3/25 through 5/29. This is playing hob with silver and oil forecast declines. Reconstructing histories of conflicts. Would like to stay short silver along with the stock market after 4/2.
Wednesday, March 24, 2010
3/24 Daily Commentary
Bonds were down sharply today, the dollar had an explosive rally, and precious metals were dragged down.
The stock market is reacting to strong dollar, poor Portugal. I1 is up so it is probably just resting. We will have to see if Nasdaq has broken it's downtrend from 2000, jury is still out:
 Financials were showing surprising resistance to the decline. IYF is destined for 59+ as animal spirits continue to push the market higher. This bodes well for the Nasdaq to break free of the trendline resistance at 2400.
I expect a couple of trends in April and May.:
1) Stocks down
2) Dollar mildly down in wave 2 of primary 3. This is counter-intuitive and will have the talking heads talking nonsense.
The following is my dollar model:
 The primary point to take home here is that a 5-wave in the dollar is coming to a close on or about 3/26 (blue line). So, the clock is ticking on my silver trade.
The second point to take home is that with today's breakout we have a pretty 5 wave up sequence. This implies another 5 wave up at some point, probably starting at the end of May and ending 8/10. The I1 has a sell signal on 5/24, so a stock market decline would feed into a dollar rally. This implies that you sell hard assets on 5/24 in expectation of a dollar rally. My work shows a decline in dollar starting 8/10 and going into October.
As I mentioned earlier the dollar model is down in April and most of May. At the same time the I1 stock model is down. Since I1 is the strongest indicator, this scenario can happen in 1 of 2 ways:
1) The stock decline is not severe and the dollar marks time (sideways)
2) The stock decline is severe and the dollar goes to the moon, confounding the dollar model. This would imply an extended 5th wave with relapses timed with the I1.
Since we have a succession of I1 sell signals after 4/22 I would tend to think that the stock market decline would be vicious during the I1 declining periods after this time. (I1 peak is 4/29 but I believe the top will be earlier). So we have a window for dollar decline until about 4/22. This would coincide with a muted stock decline up to that point. So option 1 above would apply in this scenario.
There is a lot of talk of inflationary consequences to the manipulation (stimulus). The following chart shows treasuries and corporates mid durations. This is TLT vs. LQD:
 Both bond aggregates have returned to stability as of 3 years ago, before the mayhem. Inflation would knock both for a loop downward. As can be seen the precious metals rally has not been signalling inflation as indicated by bond prices. That being said I expect higher rates until well after the stock market has started it's decline. It takes time for the upcoming collapse in risk-taking to be recognized and to channel money into fixed income, thus reversing bond price declines. At that point even the U.S. will look good relative to continued losses in other asset classes.
Any wave counts mentioned are my own. Elliott wave theory is an integral part of my trading. For information/training/books on Elliott wave see Elliott Wave International.
The stock market is reacting to strong dollar, poor Portugal. I1 is up so it is probably just resting. We will have to see if Nasdaq has broken it's downtrend from 2000, jury is still out:

I expect a couple of trends in April and May.:
1) Stocks down
2) Dollar mildly down in wave 2 of primary 3. This is counter-intuitive and will have the talking heads talking nonsense.
The following is my dollar model:

The second point to take home is that with today's breakout we have a pretty 5 wave up sequence. This implies another 5 wave up at some point, probably starting at the end of May and ending 8/10. The I1 has a sell signal on 5/24, so a stock market decline would feed into a dollar rally. This implies that you sell hard assets on 5/24 in expectation of a dollar rally. My work shows a decline in dollar starting 8/10 and going into October.
As I mentioned earlier the dollar model is down in April and most of May. At the same time the I1 stock model is down. Since I1 is the strongest indicator, this scenario can happen in 1 of 2 ways:
1) The stock decline is not severe and the dollar marks time (sideways)
2) The stock decline is severe and the dollar goes to the moon, confounding the dollar model. This would imply an extended 5th wave with relapses timed with the I1.
Since we have a succession of I1 sell signals after 4/22 I would tend to think that the stock market decline would be vicious during the I1 declining periods after this time. (I1 peak is 4/29 but I believe the top will be earlier). So we have a window for dollar decline until about 4/22. This would coincide with a muted stock decline up to that point. So option 1 above would apply in this scenario.
There is a lot of talk of inflationary consequences to the manipulation (stimulus). The following chart shows treasuries and corporates mid durations. This is TLT vs. LQD:

Any wave counts mentioned are my own. Elliott wave theory is an integral part of my trading. For information/training/books on Elliott wave see Elliott Wave International.
Subscribe to:
Posts (Atom)