Budget cut of $38B. Everyone can declare victory, until mid-May when the debt ceiling needs to be lifted. London was hit by the lefties when they cut back. Same will happen here when Congress finally cuts something meaningful. Media will go psychotic. Maybe it will happen this year for the 2012 budget. Full-court blitz to turn public opinion to the left, riots. If Tea Party pols can survive it with base intact for the 2012 elections the country has a chance. Present value of federal unfunded obligations is currently about $112Trillion and are the lead weight over all future annual budgets. As an historical aside, prior to 1917 Congress had to legislate each debt issue. The Second Liberty Bond Act granted that authority to Treasury as long as it kept below the limit. Yet another Wilson constitutional expedient abused by our government.
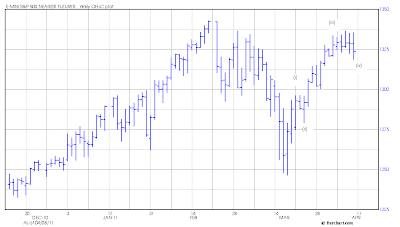
6 or 7 trading days remain until next I1 peak. The stock market has been in a wave (iv) sideways pattern since 4/1. Wave (i) lasted 3 days and wave (iii) lasted 8 days, so let's give wave (v) a tentative length of 5 days, whenever it starts.
It's been months since I have updated the outlook for crude. QE2 launched last August, provided "extra" free money to international specs, and distorted the picture for several months. Since then crude has followed it's sentiment gauge as geopolitical events have unfolded. Crude looks bullish until August. QE2 ending still won't remove the dollar carry trade and crude will probably still benefit.
Even higher oil prices will hit the world economy, especially emerging markets. China and India will be hit, in fact all of Asia. West Texas Intermediate is $112 but the average price for international delivered oil is $120 and on it's way to the old high $147. Asian and Indian shorts should be rewarding once I1 starts down. The good news is that after August crude will be on a slow,extended move downward. Earnings estimates are extremely unrealistic at this time, as occurs near the end of bull markets. With oil rising to very high levels and industrial commodites at 40% annual growth rates global growth will slow at the same time as margins face the cost squeeze. (Industrial commodities have doubled over the past 2 years.) Forward S&P GAAP earnings are $93. The last peak year, 2006, saw 81.50 actual. However, 2006 saw oil prices averaging $65, so it's probable that 2010 was peak year, as 3rd and 4th quarter earnings will be reflecting both costs and slowing sales.
S&P 500 Earnings in prior years Earnings P/E
2010 Actual GAAP Earnings $76.97 16.3
2009 Actual GAAP Earnings $50.97 21.9
2008 Actual GAAP Earnings $14.88 60.7
2007 Actual GAAP Earnings $66.18 22.2
2006 Actual GAAP Earnings $81.51 17.4
2005 Actual GAAP Earnings $69.93 17.8
2004 Actual GAAP Earnings $58.55 20.7
2003 Actual GAAP Earnings $48.74 22.8
So expect the evil speculator finger-pointing from U.S. pols for oil and food, but we know that if you throw bucketfuls of minnows into a pool of sharks that they will ramp up into a feeding frenzy. Picture Ben with the buckets, etc.
Long bonds and dollar are positions I am avoiding, both facing declines in sentiment gauges starting soon. Follow this link for a relevant post.
Subscribe to:
Post Comments (Atom)


Steve
ReplyDeleteI can see that I1 for the dollar isn't encouraging a long position, but I was wondering about a short with the EURO . I have been watching the chart for the last couple of weeks and see that the EURO has reached an upper trend line at the same time that the Dollars bulls sentiment gauge is at or close to a record low. This provides a reason for a drop in the EURO and a rally in the dollar, but doesn't mean it will do either.
This trend line I am referring to on the EURO can be drawn from the 2008 high, to the 2009 high, to last weeks high. The bottom line can be drawn from the low in 2007, to the low in 2008 to the low in 2010. Wonder if the EURO is making an A,B,C,D and then next several months would be down to the E (D = last week).
Wondering if the risk reward ratio might be worth a short in EURO/long in dollar later in the week or so. I recognize that the EURO could trade sideways for a week or two at this trend line, or just cleanly break above or below it. I guess we have to see if the market thinks that this trend line is important.
I believe that this QE I and QE II have really delayed the greater correction within the markets, but unfortunately we have to live with the politicians that has been elected by the people. This QE has messed up a lot of trading opportunities. I really believe the dollar should already be in a rally, but it sure isn't.
Thank you
DennisP
Dennis, My problem with long dollar is that Fed policy is increasingly counter to the rest of the world. When the stock markets start to decline in earnest then there would likely be some upward move in the dollar, but I will be shorting stocks unhedged. Buying the DX retest at 74.27 June futures would be a decent trade.
ReplyDeleteSteve et al,
ReplyDeleteHere is an interesting look at wave counts.
https://www.technicalindicatorindex.com/newsletter/bpdf/TII_Newsletter_1559A_4.8.11_7055475115.pdf
Charles